Viewing sensor statistics
To view the sensor statistics:
- Select Operation menu.
Colour-coded statistics are shown in the History area:
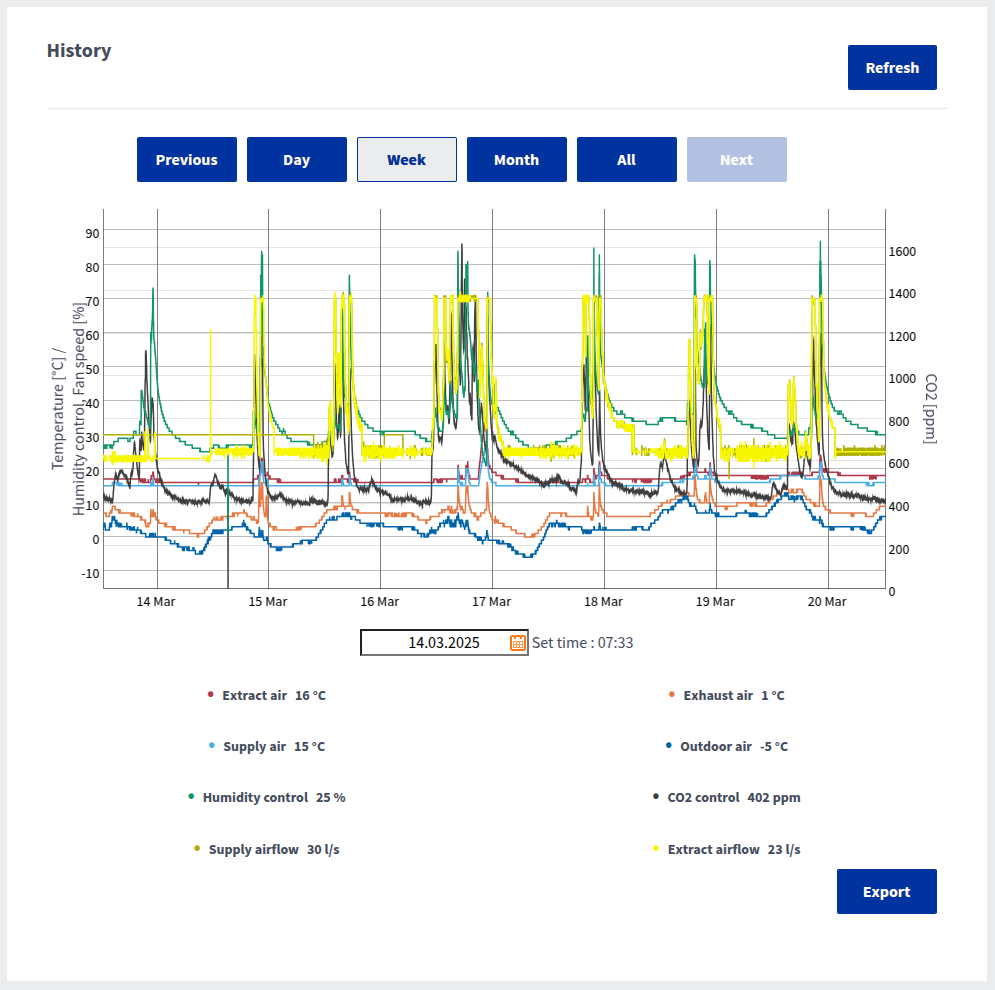
Use the buttons above the graph to select the period you want to view. In the Home UI, only the last three days are shown, but in Cloud you can view longer periods.
- To update the statistics, select Refresh.
- To save the statistics, select Export.The file is saved in Excel format. This function is only available in the MyVallox Cloud interface.