
Viewing temperature statistics
To view the temperature statistics:
-
Select Settings.

-
Use the Arrow buttons to select Temperatures and sensors:
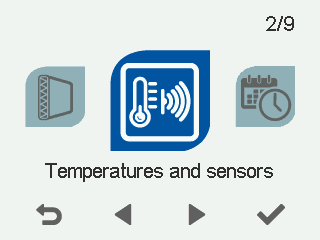
-
Select OK.
 Tip:
Tip:The temperature and sensor data can also be viewed by pressing the temperature button on the mode display:

The summary display of temperatures opens:
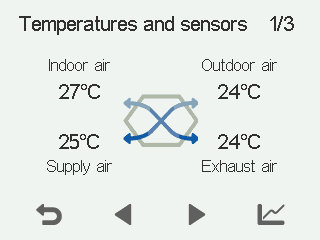
-
Select Statistics:

A graph then opens showing the indoor air temperature over the last 24 hours:
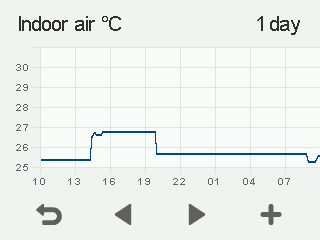 Note:
Note:A power cut erases daily statistics.
-
To view weekly statistics, select Plus:

A graph then opens showing the indoor air temperature over the last seven days:
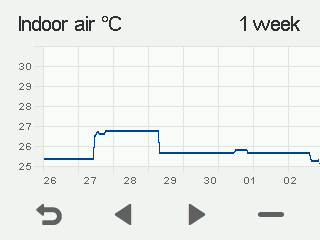
-
Return to the daily statistics by selecting Minus:

-
Return to the temperature type selection by selecting Back:

-
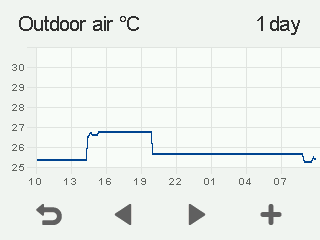
Select Right arrow.
A graph then opens showing the outdoor air temperature over the last 24 hours:
-
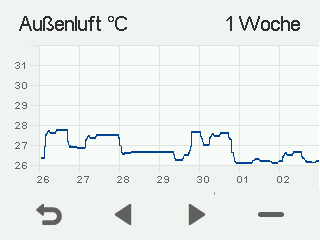
To view weekly statistics, select Plus:
A graph then opens showing the outdoor air temperature over the last seven days:
-
Return to the daily statistics by selecting Minus:
-
Return to the temperature type selection by selecting Back:
-
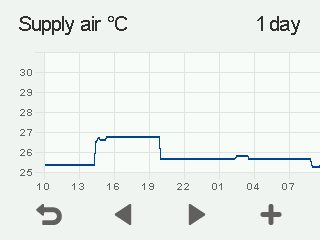
Select Right arrow.
A graph then opens showing the supply air temperature over the last 24 hours:
-
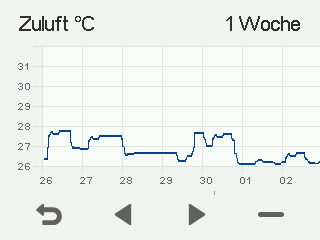
To view weekly statistics, select Plus:
A graph then opens showing the supply air temperature over the last seven days:
-
Return to the daily statistics by selecting Minus:
-
Return to the temperature type selection by selecting Back:
-
Select Right arrow.
A graph then opens showing the exhaust air temperature over the last 24 hours:
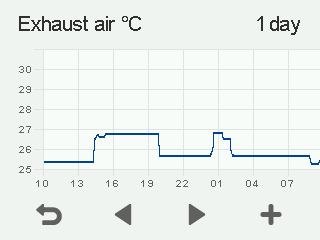
-
To view weekly statistics, select Plus:
A graph then opens showing the exhaust air temperature over the last seven days:
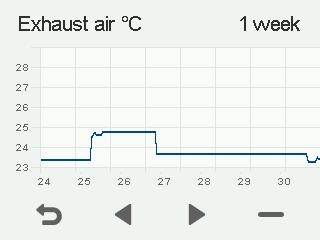
-
Return to the daily statistics by selecting Minus:
-
Return to the temperature type selection by selecting Back:
-
To exit the menu, select Back: