Viewing the relative humidity of air and carbon dioxide level statistics
To view the relative humidity of air and carbon dioxide statistics:
-
Select Settings:

-
Use the arrow buttons to select Temperatures and sensors:
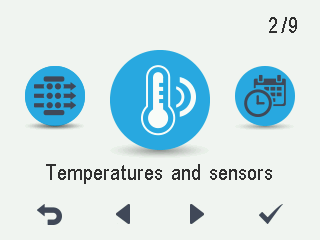
-
Select OK:

Tip
The temperature and sensor data can also be viewed by selecting the temperature button on the profile display.

The summary display of temperatures and sensors opens:
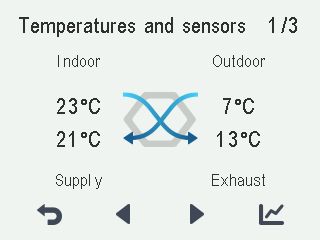
-
Select Right arrow.
The relative humidity of air values measured by humidity sensors 1-3 are displayed.
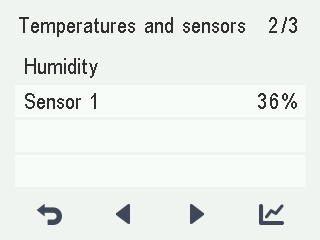
-
Select Statistics:

A graph opens on the display showing the relative humidity of air recorded over the last 24 hours by the sensor with the highest levels:
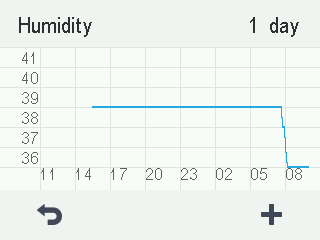
-
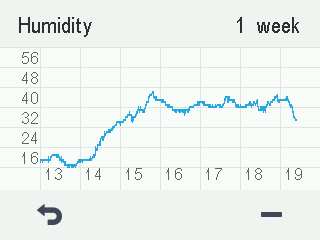
To view weekly statistics, select Plus.

A graph opens on the display showing the relative humidity of air recorded over the last seven days by the sensor with the highest levels:
-
Return to the daily statistics by selecting Minus:

-
Return to the sensor group selection by selecting Back:

-
Select Right arrow.
The relative humidity of air values measured by the humidity sensors 4-6 are displayed. Statistics can be viewed as with the sensors 1-3.
-
Return to the sensor group selection by selecting Back:
-
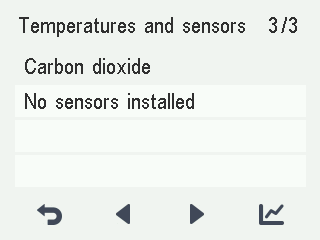
Select Right arrow.
The carbon dioxide values measured by carbon dioxide sensors 1-3 are displayed.
-
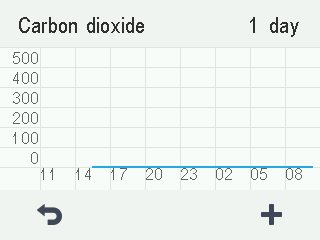
Select Statistics:
-
A graph opens on the display showing the carbon dioxide level recorded over the last 24 hours by the sensor with the highest values:
-
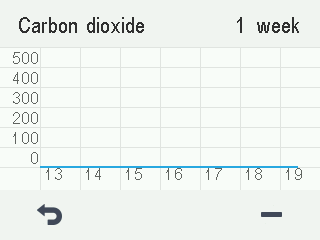
To view weekly statistics, select Plus.
-
A graph opens on the display showing the carbon dioxide level recorded over the last seven days by the sensor with the highest values:
-
Return to the daily statistics by selecting Minus:
-
Return to the sensor group selection by selecting Back:
-
Select Right arrow.
The carbon dioxide values measured by carbon dioxide sensors 4-6 are displayed. Statistics can be viewed as with the sensors 1-3.
-
Return to the sensor group selection by selecting Back:
-
To exit the menu, select Back: